Metrics That Matter
23 KPIs for record marketing
I write about music marketing via my weekly newsletter, Deep Cuts [Subscribe]. Get daily tips on Instagram @deepcuts.co.
When you start a record campaign, your label lays out Key Performance Indicators (KPI) to evaluate a campaign’s success or failure, which govern whether your project continues to be funded or phased out.
Streaming and social platforms allow us to see the real time impact of marketing efforts via a wall of metrics that when pieced together tell a story. However, few artists know which metrics are the right metrics. Some are more accurate at predicting an artist’s success than others, and therefore should be more important to music marketers.
This post is meant to make measuring success simple by showing which KPIs are most accurate at measuring the true impact of marketing records.
23 success metrics for measuring record campaigns ranked by business impact →

Metrics list at quick glance
- Active Coverage
- Audience (Radio)
- Buzz
- Chart Performance
- Click Through Rate
- Consumption
- Cost Per New Listener
- Efficient Reach
- Engagement Rate
- Follower Growth (Social)
- Monthly Listeners
- Pitch Performance
- Playlist Reach
- Playlist Real Estate
- Potential Reach
- Profile Followers (DSP)
- Return on Digital Spend
- Revenue
- ROI
- Sentiment
- Spins
- Territory Growth
- Video Completion Length
Marketing & Sales KPIs

1) ROI
Return on Investment. Dollar amount you needed to spend to yield a result, which can be a positive or negative value.
Return on investment (ROI) = (revenue from marketing) — (marketing spend) / marketing budget.
Provides guidance to artist/team on the relative value of a marketing investment, which prioritizes future budgets, cuts initiatives that make little return and informs artist(s) how they best spend their time.
ROI must be considered in context of the wider marketing plan — strong ROI can be created by insignificant investments (e.g.: $50 Facebook spend that produced 300% growth via ticket sales) and larger activities (e.g.: music videos) may not manifest ROI until years after.
2) Playlist Reach
Total number of followers from each playlist a track appears on. Usually represented individually by each DSP.
Sum (playlist followers)
Shows potential audience size exposed to a track. Labels use this metric to compare support from each DSP and see how reliant the release is on editorial playlists. If an artist has a much higher playlist reach from editorial (Spotify’s Rap Caviar, Today’s Top Hits, Pollen) than non-editorial (users own, third party’s) you have a problem. When they remove you, your growth takes a nosedive.
This metric is bloated on release week with the addition of New Music Friday.
3) Playlist Real Estate
Visibility of a track on DSPs as shown by the weekly change in number of playlists a track is added or removed from, playlist position.
Playlists are how people discover music and a marketers job is about getting the artist/song in front of as many people as possible, and getting them to care, thus visibility on playlists indicates the potential audience size to discover the music
4) Monthly listeners
Unique listeners of an artist in a 28 day period. The number of times an individual streams a song does not effect the monthly listener, if one person streams one song and another 300 times, they each count as 1 monthly listener
Sum total of unique listeners in a 28 day period
Monthly listeners and monthly streams are usually lumped in the same reporting. Monthly streams are more easily manipulated than Monthly Listeners, however reporting on these must be considered in the wider growth of the artist long term — which is where profile follows comes into play.
5) Profile Followers (DSP)
Unique followers of an artist’s profile
If the goal governing 99.99% of record campaigns is to reach millions of people and earn streaming/sales revenue, then followers suggest how aware people are of your artist. An act with high monthly listeners or playlist reach may generate millions of streams but have low brand awareness — people know the song but not the artist.
Followers to streams ratio is an indicator of interest in an artist vs. miscellaneous streams generated by playlists and algorithms. If an artist has fewer than 1:20 followers to monthly listeners then you have a problem with branding and over-reliance on editorial support, therefore must invest in brand building activities.
Emerging artists (>1M monthly listeners) generally average 1:10, established acts (>5M monthly listeners) average 1:5 followers to monthly listeners.
and therefore you need to invest in brand building marketing activities.
6) Consumption
Total sales earned from physical sales (CD, cassette, vinyl), digital downloads, streams, and monetized video views.
Consumption underpins revenue, which is the ultimate goal. Labels base marketing budgets on consumption projections at key campaign periods including: week 1, month 1, month 6 and month 12.
Consumption includes sales from physical and digital, streaming (lean forward and lean back).
7) Territory Growth
Difference in consumption in a specific country, region or set of cities
(consumption this week) — (consumption last week) / number of weeks active campaign
Streaming and social media has made music more global in that artists and songs can be more readily discovered in different territories before crossing over to larger markets like the US, e.g.: Rich Brian, Lewis Capaldi.
8) Revenue
Total money made by an artist over a period of time.
Sales $ + streaming $ + merch $ + sync/licensing + D2C $ + touring
Revenue is often the penultimate goal but as a metric is misleading because it is surface level, not indicating marketing spend or ROI. Revenue alone focuses on short term and immediate returns whereas the impact on specific marketing activities can take months or years to actualize
9) Chart Performance
Ranking of the top played, streamed, watched or sold tracks and albums in a given period as reported by Nielsen SoundScan. Includes iTunes, Apple Music, Spotify Viral 50, Spotify Global, Billboard, Shazam, SoundCloud, YouTube and others
Calculation: \_(ツ)_/¯ nah but seriously, each platform has their own method. If you’re interested here’s Billboard, iTunes/Apple, Spotify, Shazam, SoundCloud
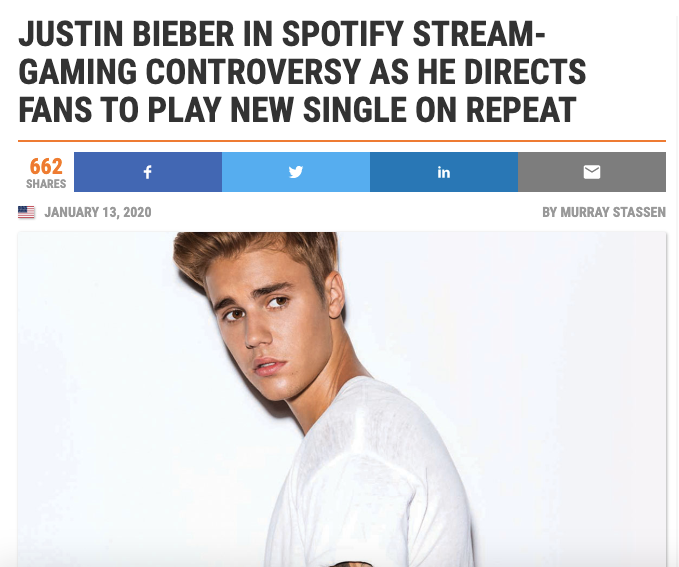
Billboard charts are still considered to show the winners in culture however come under scrutiny with chart manipulation through sales techniques i.e.: Travis Scott or Taylor Swift’s extensive merch and ticket bundling to nab the top spot, or Bieber telling his fans to stream his new single with a VPN set to the US to game the US charts.
Digital charts like iTunes, Apple Music, Spotify Viral 50/Global 50, Deezer, SoundCloud indicate performance within specific platform algorithms, which is important since the role they play is by steering visibility/invisibility of an artist and attract attention
Digital & Social KPIs

10) Return on Digital Spend
Dollars generated from specific paid social and digital media buys vs. cost of creating the asset. Measured using pixel trackers and affiliate/microsite links like LinkTree, SmartURL.
($ Sales from Marketing — $ Marketing Spend) / $ Marketing Spend
Tracking the return of digital spend means the marketer needs to create a system that identifies sales/streams to digital impressions where each tactic is given credit to its revenue generated. This helps marketers push back or justify creative decisions of an artist.
11) Cost per New Listener
The dollar value of a new listener as determined by the costs of creative assets, media spend and online publicity for a specific marketing initiative by the number of new unique monthly listeners.
($ marketing budget) / (revenue generated by activity) — (costs)
Shows marketing operating efficiency and helps artists and labels determine interest in an artist that is organic vs. paid. This metric is especially important for labels with many developing artist projects as it predicts growth trajectory of one artist over another. If your cost per new listener is higher for artist X than Y, it indicates artist X is not resonating with new audiences as much as artist Y.
12) Buzz
The total number of times an artist or record is mentioned across social media platforms, tracked weekly to determine the growth/decline
Number of social mentions on social platform
Helps understand the virality, scale and impact of a release; also used to mine for conversation topics and sentiment.
A positive result when mining for conversation is that audiences are discussing things other than “new music out today”, resharing headlines or posts from the artist.
Things like active discussion in subreddits and comment sections on IG/FB or on Twitter. This tells you that people are more interested in an artist as a whole brand and relevancy doesn’t need to be propped up by new music promotions.
That said, people posting on the internet about a release or artist represent a much smaller subset of the entire audience segment and therefore can be misrepresentative of what’s actually going on in consumers’ minds.
13) Follower Growth
The difference in profile followers week on week across social media and DSPs.
(profile followers this week) — (profile followers last week) / total followers *100
Can be meaningful as a social cue to people just discovering you and industry gatekeepers who look for social proof before offering opportunities. But more often than not is vanity.
14) Click Through Rate
Percentage of ad impressions from an individual asset or campaign that generated a click.
The percentage of ad impressions with click-throughs
Most commonly used for campaigns driving an action, i.e.: album/single pre-saves, contesting, email or text message sign up, new releases driving social audiences to streaming.
15) Video Completion Length
Average length of completion in time (minutes, seconds) of your video
Helpful in understanding how much of a message a viewer has seen and how future videos could be made for better retention. This metric becomes critical in music since the music video is one of the most heavily invested line items in the marketing budget. Video watch time is a more useful metric than completion rate as you can pinpoint the moment when you begin to lose audiences, which is useful to inform creative decisions.
For ancillary content like tour announcements, interviews, sessions, BTS etc. video watch time shows how much of the message the average viewer is getting. If you made a 2-min tour announcement video dropping all the dates — but most people only watch to :20 — it’s likely some people missed their city info.
16) Efficient Reach
The ratio of paid to earned media.
Understand campaigns lead by PR or social media, as well as how much an asset naturally resonated with audiences i.e.: music videos. If earned media is high it indicates “buzz”, that the music video struck a chord with viewers and therefore they shared/commented/sent to friends or wrote about it in the press.
This metric is useful in music for 2 reasons.
- The standard belief is “content is king” that a great song or great video will break an artist any day of the week compared to heavy investment in paid advertising
- Paid advertising budgets are usually a smaller % of overall marketing budgets than music video, radio, publicity and touring and therefore every dollar needs to work harder.
17) Engagement Rate
% of impressions that drove consumers to actually interact with the asset — usually applied to social media campaigns as a proxy for fan loyalty.
Interactions with digital asset / Impressions of digital asset
Signals how an element of the campaign is sticking with audiences. For example, a tour announcement, single release or new video. However, it is a vague metric and often influenced more heavily by the platform’s algorithm and how it prioritizes and personalizes content, thus rendering assets visible/invisible.
Calculations also vary from platform to platform and can encompass a mix of comments, likes, shares, contest entries, sign-ups to email/text, views, saves to library, adds to playlists etc — can be misleading when comparing across platforms.
Press KPIs

18) Potential Reach
Total viewership for publication, websites and blogs your coverage is featured
Social impressions from post sharing the article. Estimated monthly website traffic.
When weighing up premieres, interviews and features of a media outlet, artists use reach to figure out if said media outlet is worth the scoop. If outlet X has a larger monthly website traffic and social following than outlet Y, they will likely get the premiere.
19) Active Coverage
Coverage secured by the PR team
Links, press clippings to public coverage
Tells you where your music has been pitched and relative feedback. It is helpful to split this KPI into top-tier publications vs. everything else. When you begin the release you sit down with your publicist and go over your goals for coverage (e.g.: late night TV and a NYTimes feature). Group your top-tier publications into one KPI to measure against initial goal and everything else is caught separately.
20) Pitch Performance
The number of press releases and pitches you are sending out and how they are performing.
Along with the amount of coverage they generate, you can also measure your progress in building relationships with journalists (a good distribution tool provides metrics on open rates and even internal links clicked).
21) Sentiment
Tone of the articles mentioning your name, release or competitors.
Qualitative analysis
Lets you see if your brand is creating positive or negative associations and is useful when going through a rebrand and dealing with media crises.
Radio KPIs

22) Audience
Sum total of listeners to specific radio stations the track is played on. Individual audience members quantified as listening for a set period of time (often 5 minutes) within a given quarter hour segment.
23) Spins
Number of times an individual track is played on a specific radio station.
Increase/decrease in spins reflects station support for a song, which can be a measure of local interest in a track by consumers.